Synopsis of Phytoplankton Conditions from CBRSP Flights 1989-2012
CBRSP flights have documented tremendous inter-annual variability of phytoplankton distributions in the Bay. Much of this variability can be traced to the variable rainfall in the Bay’s watershed and the impact on freshwater input and nutrient loading from the Susquehanna River and other large rivers and tributaries that feed into the estuary. A spring bloom consisting primarily of centric diatoms is a common feature of the annual phytoplankton cycle. Chlorophyll (chl-a) concentrations commonly exceed 20 mg m-3 in April and May and may extend over 100 km along the main stem axis of the Bay. We have learned much about the timing, position and magnitude of the spring bloom from remotely sensed observations, allowing us to develop a conceptual model based on many years of observations (cf. Miller and Harding, 2007). The spring bloom is responsible for the uptake of nutrients, sequestering them in phytoplankton biomass, and providing the substrate for ‘regeneration’ of nutrients that fuels summer productivity by a flora that transitions between spring and summer to include a number of other phytoplankton taxonomic groups.
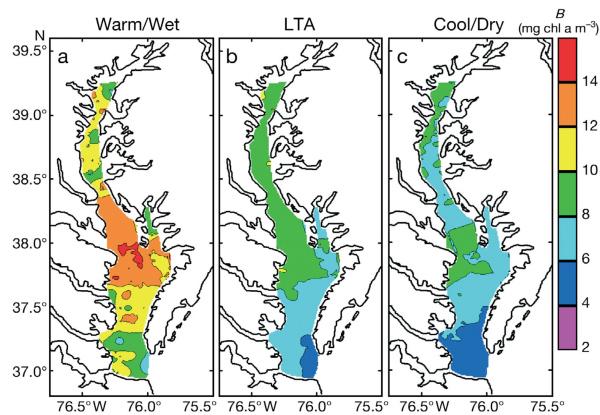
Climate effects on spring-bloom chlorophyll (chl-a) distributions from CBRSP data (1989-2005) for: (a) warm/wet, (b) long-term average, (c) cool/dry conditions (from Miller and Harding 2007).
In years of high rainfall and high river flow during spring (1993, 1994, 1996, 1998, 2004, 2005, 2011), suspended sediment and nutrients carried in freshwater influence light and nutrient conditions in receiving waters of the entire main stem of the Bay. Algal abundances in high-flow years are often very high, particularly during the spring bloom period dominated by planktonic diatoms, and highest chlorophyll concentrations generally develop seaward of the peaks we observe in years of moderate or low flow. In years of low rainfall and reduced freshwater flow (1995, 1999, 2001, 2002), nutrient delivery is much reduced and phytoplankton biomass declines in the main stem of the Bay. The position of the spring chlorophyll maximum is related to the timing and magnitude of freshwater flow because nutrient inputs are largely derived from the Susquehanna River at the head of the Bay.
Examples of phytoplankton distributions for specific years
The following paragraphs summarize results from CBRSP for some example years with contrasting conditions, demonstrating the strong effect of climate on phytoplankton dynamics.
1989 –
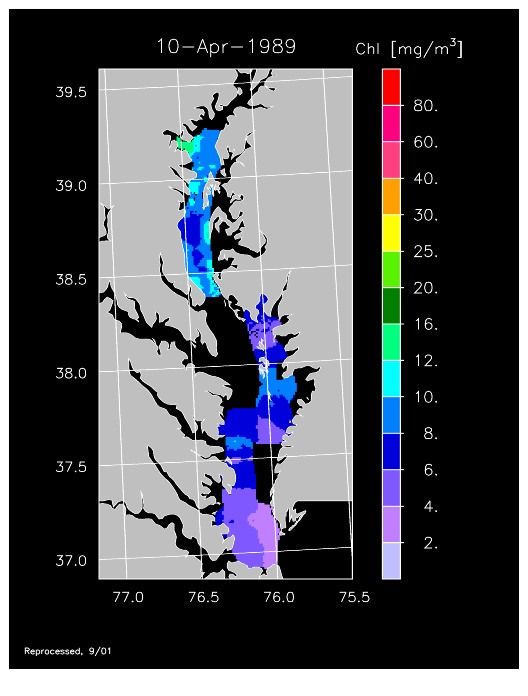
The first operational year of CBRSP with ODAS gave us a new view of the Bay from a series of 14 flights focusing on the spring bloom. We observed very low chl-a throughout much of the Bay, coinciding with a prolonged drought that resulted in low freshwater flow and nutrient inputs. Chl-a < 10 mg m-3 occurred throughout the Bay during spring, exemplified by imagery for 10 April. Please note that spatial gaps in coverage were associated with restricted airspace in mid-Bay that we were unable to sample in the early years of the program. Higher chl-a occurred in summer, as evident in imagery for 12 June when concentrations > 20 mg m-3 were measured. 1989 was an odd year with virtually no spring freshet, but increased freshwater flow from summer to fall.
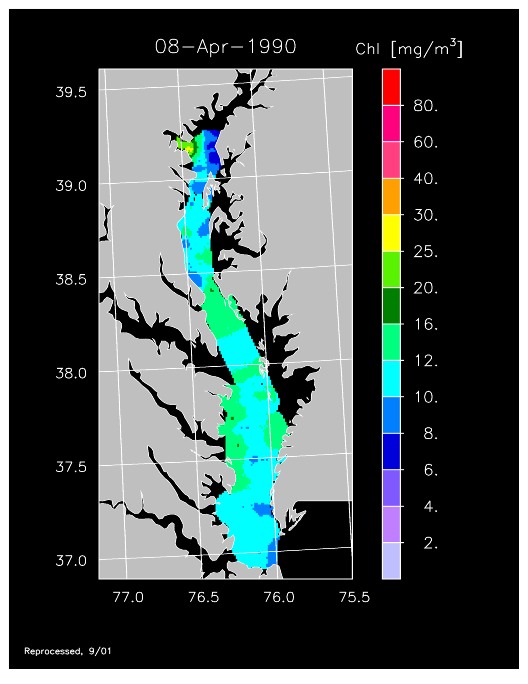
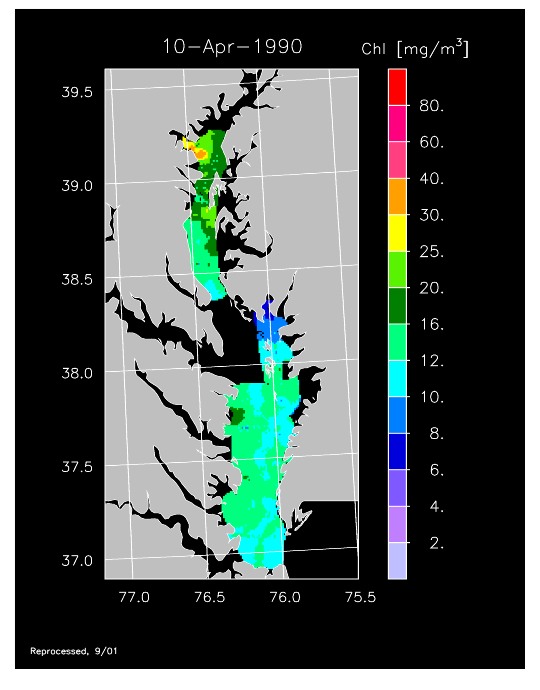
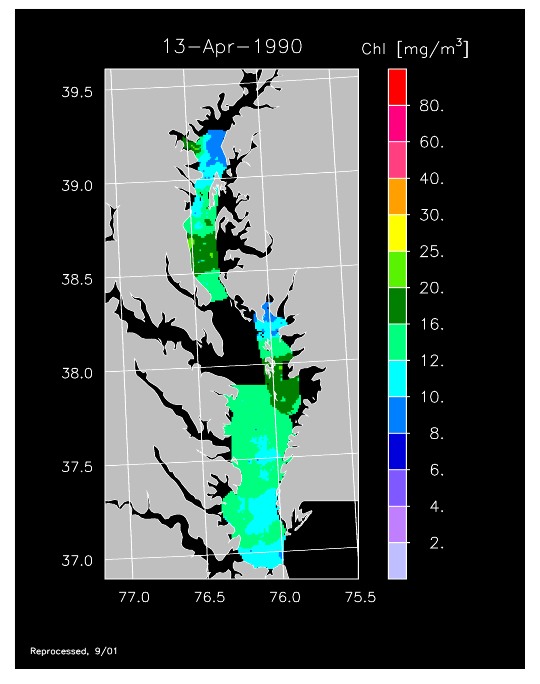
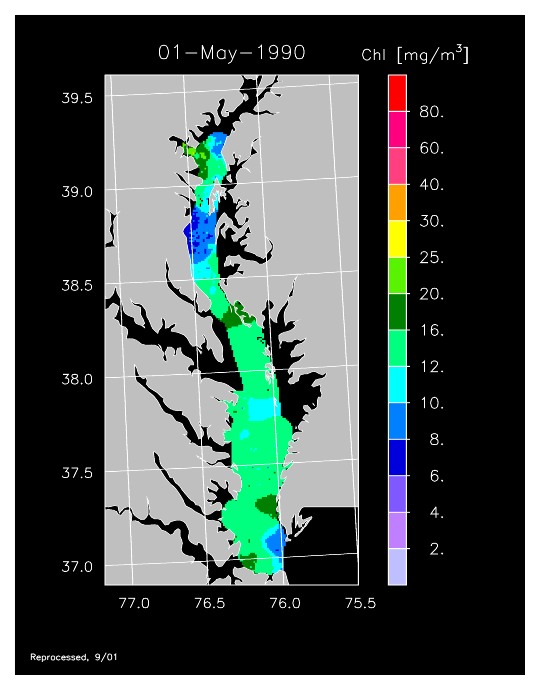
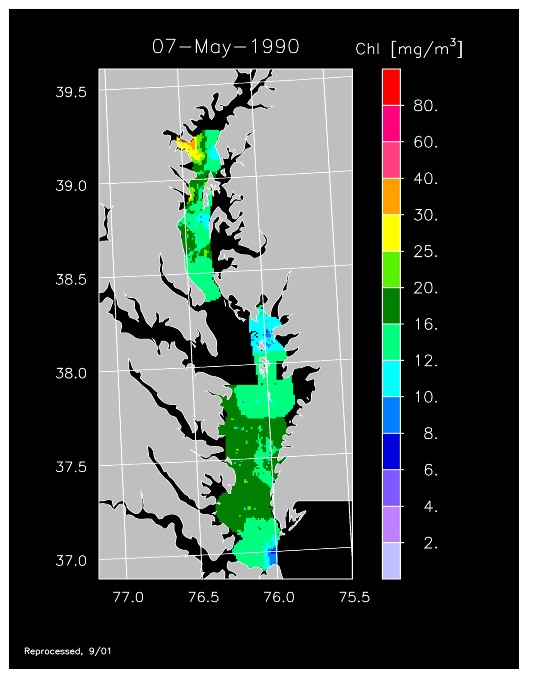
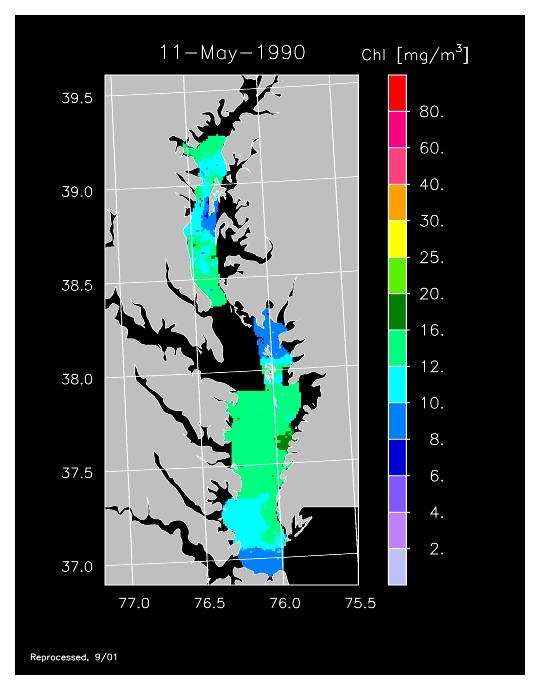
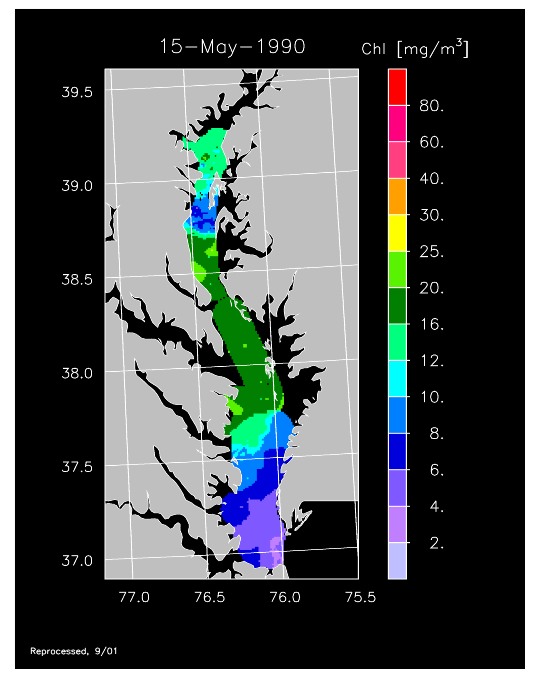
1990 –
In strong contrast to 1989, the spring bloom in 1990 was quite well developed, as shown in imagery for 8 April, 10 April, and 13 April 1990. Flow was near to above average, resulting in the delivery of nutrients sufficient to support chl-a > 20 mg m-3 extending from Annapolis to the lower Bay. The spring bloom was extremely long-lived with late April imagery showing a continuation of high chl-a that included localized blooms in the upper Bay found to consist of the dinoflagellate, Prorocentrum minimum. Imagery for 1 May, 7 May, 11 May, and 15 May 1990 showed similar, high chl-a extending well seaward along the main axis of the Bay.
1998 –
1998 experienced high spring flow, reminiscent of a near-record year in 1996, but not quite as extreme. A well-developed phytoplankton bloom was observed in the mid- to lower Bay, as shown in the chl-a image for 21 April 1998. High freshwater flow from the Susquehanna R. in spring was followed by a prolonged summer drought with lower nutrient inputs to the Bay. Relatively high summer chl-a was observed despite the low flow, fueled by regenerated material produced in the spring, as shown in the chl-a imagery for 24 July and 3 August 1998.
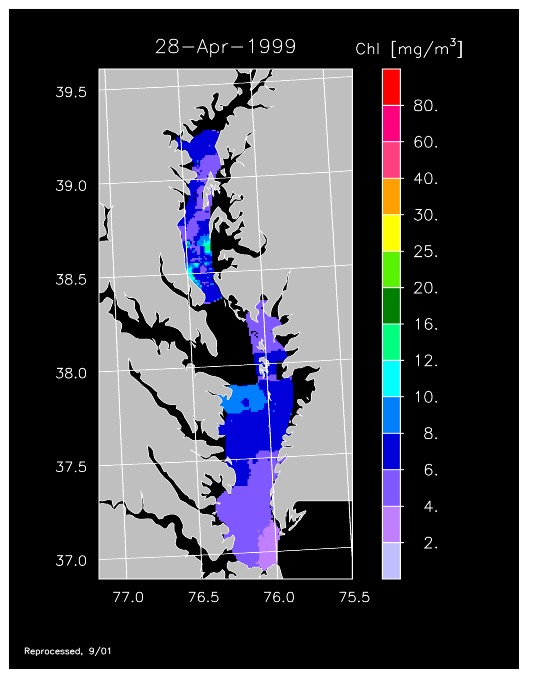
1999 –
A regional drought characterized 1999 was characterized and freshwater flow was very low, affecting nutrient loading and resulting in much-reduced phytoplankton abundance that was evident in remotely sensed chl-a data. These conditions persisted throughout early spring, as shown in imagery for 6 April to 28 April 1999. Despite the low freshwater flow, conditions reversed in May and high chlorophyll was detected in much of the Bay, as shown in imagery for 11 May and 21 May 1999. Imagery for 9 June 1999 indicated this condition persisted into early summer. By mid-June chl-a declined and relatively low concentrations were observed for the remainder of summer.
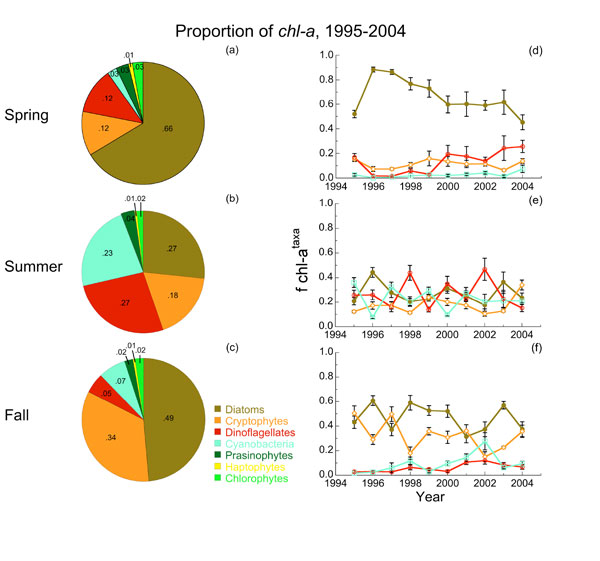 Seasonal variability of major phytoplankton taxonomic groups in the main stem of Chesapeake Bay from pigment reconstructions of cruise samples, 1995-2004.
2000 –
Phytoplankton blooms occurred at a number of locations in Chesapeake Bay during 2000. Most images for April and May 2000 show chl-a from 10 to 30 mg m-3 covering large areas of the Bay. Data for 14 May 2000 show chl-a > 30 mg m-3 in the mid to upper Bay coinciding with dinoflagellates of the common Bay species, Prorocentrum minimum, that form annual blooms in this region. Seaward peaks of chl-a were associated with abundant diatoms of a variety of species, including Skeletonema costatum, Rhizosolenia spp., and Cerataulina pelagica. By early June, chl-a had declined appreciably during a floral transition to summer forms. Chl-a increased again in late June to early July 2000, particularly along the western shore of the mid- to upper Bay between Annapolis and the mouth of the Patuxent River.
2002 –
Low deliveries of freshwater and nutrients to the main stem of the Bay from the Susquehanna R. and other riverine sources associated with a drought characterized 2002. These conditions resulted in low chl-a during spring that revealed a much reduced spring bloom. Imagery for 6 March, 28 March, 16 April, 24 April and 30 April 2002 showed concentrations < 6 mg m-3 throughout the mesohaline to polyhaline regions of the Bay, i.e., seaward of the Patuxent R. mouth. Some localized increases of chl-a to concentrations > 15 mg m-3 occurred in the upper Bay, as shown in imagery for 16 April, 24 April, and 30 April 2002 near the Patapsco R. mouth. Summer chl-a was also low in much of the Bay, with the exception of the oligohaline and upper mesohaline regions where chl-a > 20 mg m-3 occurred in July and August between the mouths of the Patuxent and Patapsco R. A typical decline of chl-a in fall was detected throughout the Bay.
2003 –
2003 had higher-than-average freshwater flow and experienced a well-developed spring bloom. Imagery for 3 April, 14 April, 24 April, 20 May, and 30 May 2003 show high chl-a >20 mg m-3 covering much of the mid- to lower Bay.
2005 –
Remotely sensed chl-a data for 2005 revealed another strong spring bloom, exemplified by imagery for 11 April and 18 April 2005.
2009 –
Data for spring 2009 showed a modest spring bloom in April, as shown in imagery for 5 April and 17 April 2009 with high chl-a in the mid-Bay. Later in the season we observed high chl-a > 30 mg m-3 in the upper Bay, associated with a fairly large bloom of the dinoflagellate, P. minimum.
2010 –
Imagery for 2010 revealed a fairly reduced spring bloom with low chl-a < 10 mg m-3 throughout much of the Bay, with the exception of imagery for 19 April 2010 that showed fairly high chl-a. Summer chl-a was low until late July when localized blooms in the upper Bay appeared. Imagery for 26 July and 7 August 2010 showed elevated chl-a along the western side of the mainstem Bay.
2011 –
We began remote sensing on the Bay in late winter this year with flights on 4 Mar 2011 and 25 Mar 2011 that showed seasonally low chl-a throughout the Bay. Weather conditions have been cold and windy, much of the upper Bay remains quite turbid, and the spring bloom has not initiated at this writing. We will begin more closely spaced flights in early April to capture the bloom that typically peaks in April to May.
2012 –
In 2012, freshwater flow was low to average, supporting a spring bloom that we detected in chl-a imagery for April. Highest chl-a occurred in the mesohaline and polyhaline regions of the Bay, with concentrations reaching 12-16 mg m-3 on 8 April and 15 April 2012. From May - Sept, chl-a was < 10 mg m-3, with only occasional increases of chl-a as shown in imagery for 27 May 2012 for the eastern polyhaline region of the Bay.
Relevant Publications connects to citations that provide additional details about the program and uses of the data to detail phytoplankton dynamics in the Bay.